Skip to content
Analytics

The whole floor, seen from above

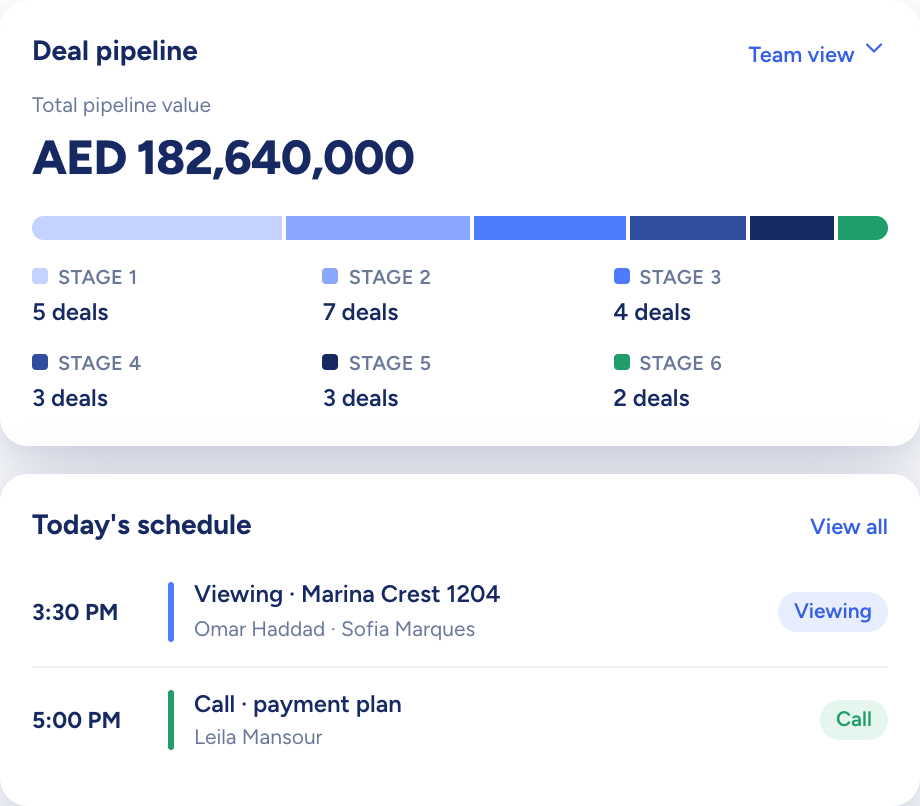
Everyone lands on the same dashboard. Agents get their own figures, team leads switch to Team for the sum of their people, and admins take in the whole agency. Pipeline value, deals at each stage, today's schedule and new stock share one screen.

A curved white model desk with three blank screens and a blue glow
The dashboard: total pipeline value by stage above today's schedule
  • Stage counts under one pipeline total
  • Your view or the team's, one toggle apart
  • This week's new stock along one strip
How it flows

Deals and activities in, the full picture out

What goes in

  1. 01 Your deals ValuesStagesCommission splits
  2. 02 Your diary ViewingsLogged callsAnything overdue
  3. 03 New records Contacts this monthListings this week
The dashboard: total pipeline value by stage above today's schedule

What comes out

  • Three views PersonalTeamWhole company
  • Deal Pipeline Total valueHow many at each stage
  • Today ScheduleViewingsViewing requests
What it does

One screen, three heights

The layout never changes; only its reach does. A personal view is where every user starts, with their own figures and the day's bookings. Team leads toggle to Team for the combined numbers of everyone they lead, and admins see every team and user in the workspace.

  • A personal view for every user
  • Team totals for team leads
  • Team figures follow who is on the team today

Three tall white model towers lit blue, above a waterfront row of low buildings and palms
The dashboard: total pipeline value by stage above today's schedule

Every stage of the pipeline, counted and valued

The Deal Pipeline card puts one figure on everything in play, then a bar breaks it down by how many deals sit at each stage. Tiles above it track overdue activities, upcoming viewings, every active deal, the commission on won deals and how this month's new contacts compare with last month's.

  • New contacts, compared with last month
  • Overdue activities counted for you
  • Commission worked out on won deals
A model house moving along a track through a series of white arches towards a key

Viewings, requests and new stock, in one sweep

Requests come first: clients ask for viewings from the listing pages you share, and each request lands in its own side panel, ready to schedule. Beside it sit the latest viewings and the most recent active deals, while a full-width strip below lays out this week's new listings. Rather see a chart? Ask Raptor.

  • Each request shows the times the client offered
  • Recent active deals with stage and price
  • Charts from Raptor, built on your own deals
An arc of small message cards passing over a row of model houses

Analytics at work

The jobs it takes off an agent's desk, week in, week out.

Questions

Asked and answered

Who sees the team and company views?

Every user has the personal view of their own figures. Team leads can switch to the team view, which adds up everyone on their team, and the admin view covers every team and user in the workspace.

All three use the same layout.

How is the commission figure worked out?

For each won deal, Raptor Neo multiplies the offer amount by the commission split set on the listing. Those figures feed the Commission tile.

Which deals count as active?

Every deal that hasn't closed yet, won or lost. Once a deal closes it drops out of the active count.

What happens to team numbers when someone changes team?

Team totals follow the team as it stands today. Move an agent and the team view shows it straight away; past figures are not rewritten.

Can I get a chart without opening the dashboard?

Yes. Ask Raptor to chart your deals by stage and it draws the chart from your own deals.

Every dealin sight.

Start the free trial today, or book a demo and see it run on your own listings.